Table of Contents
How to use data analytics to track your production line efficiency?
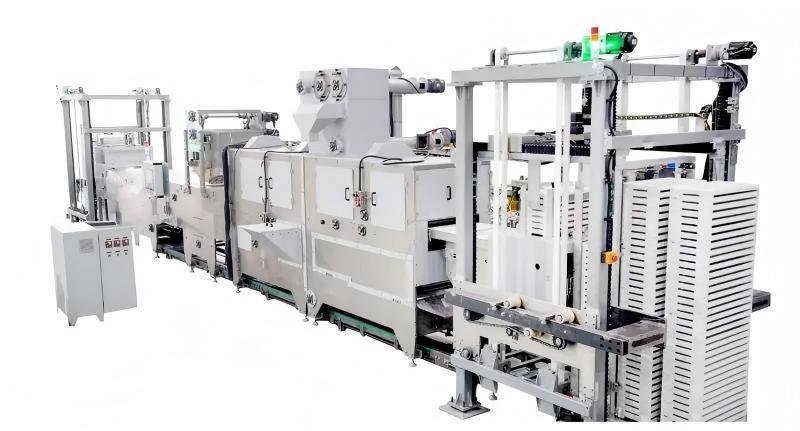
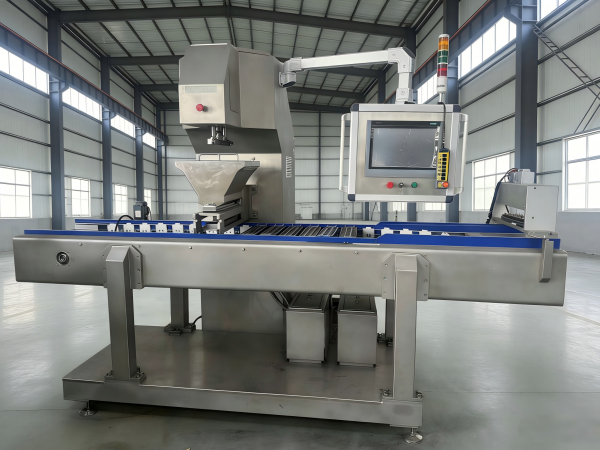
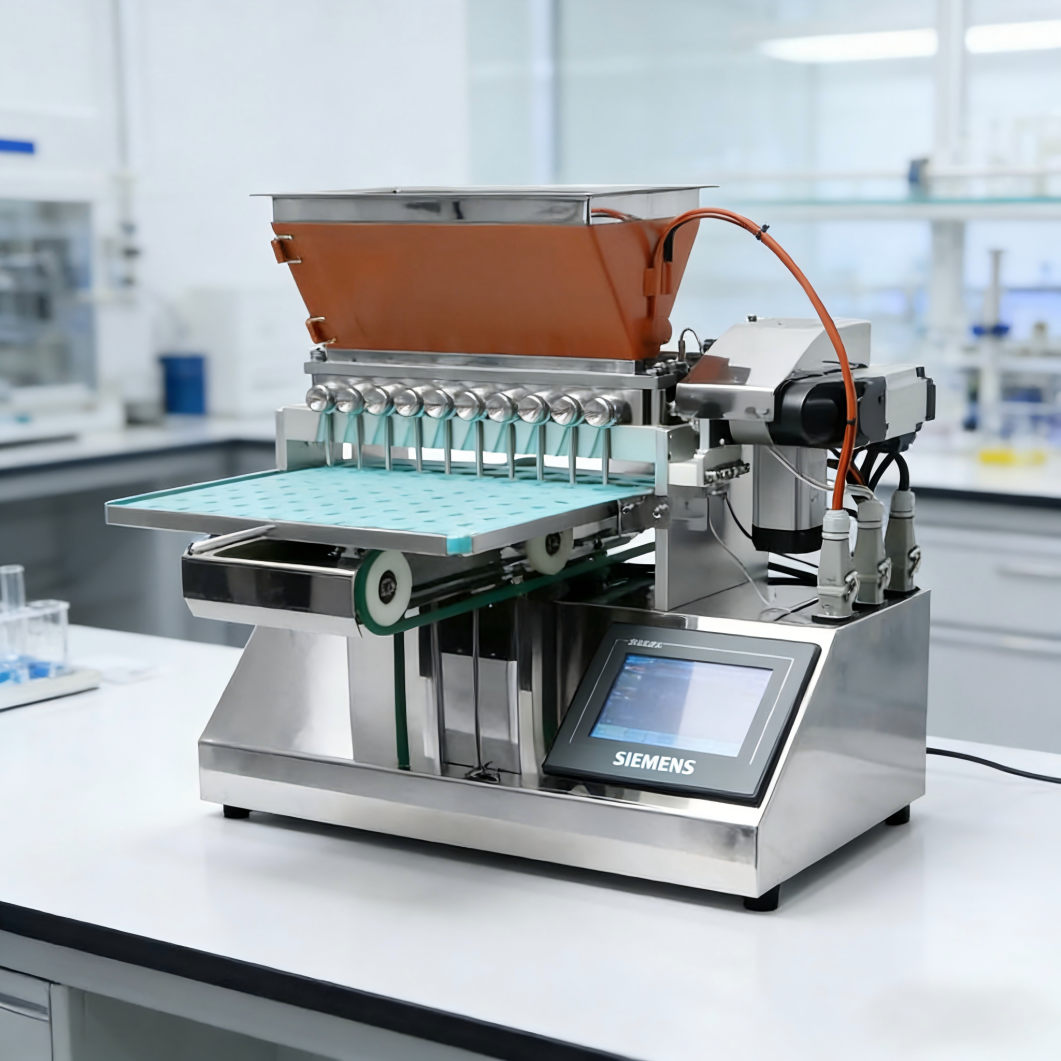
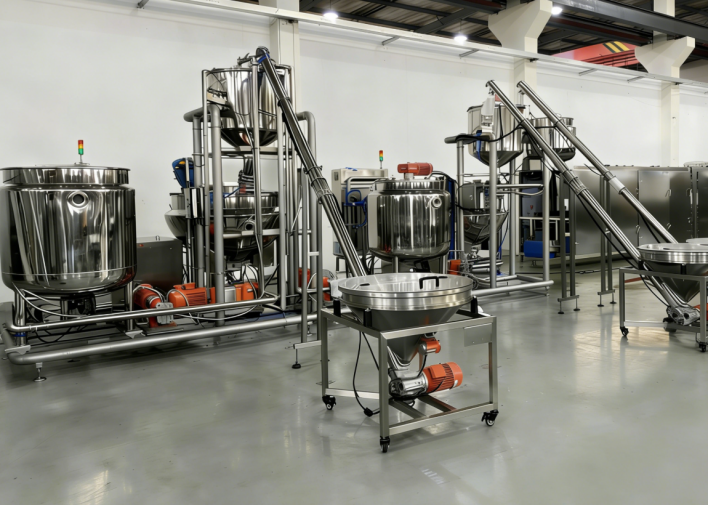
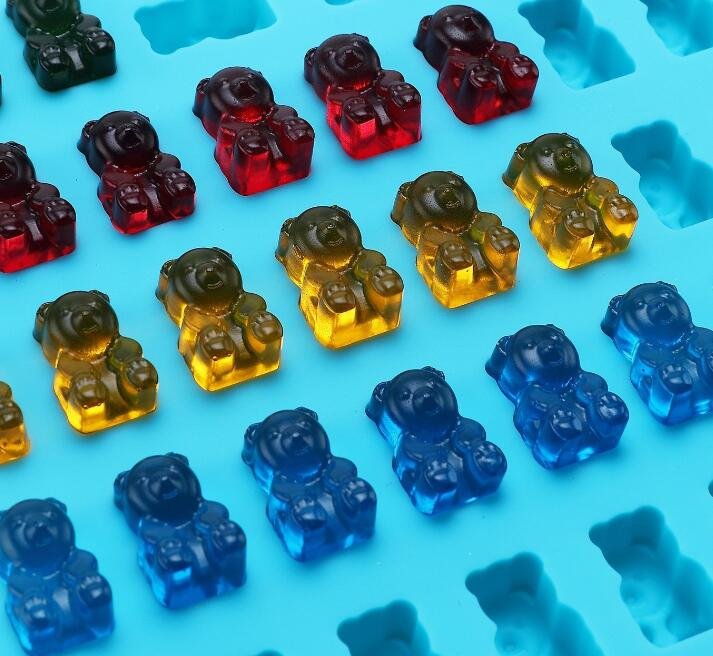
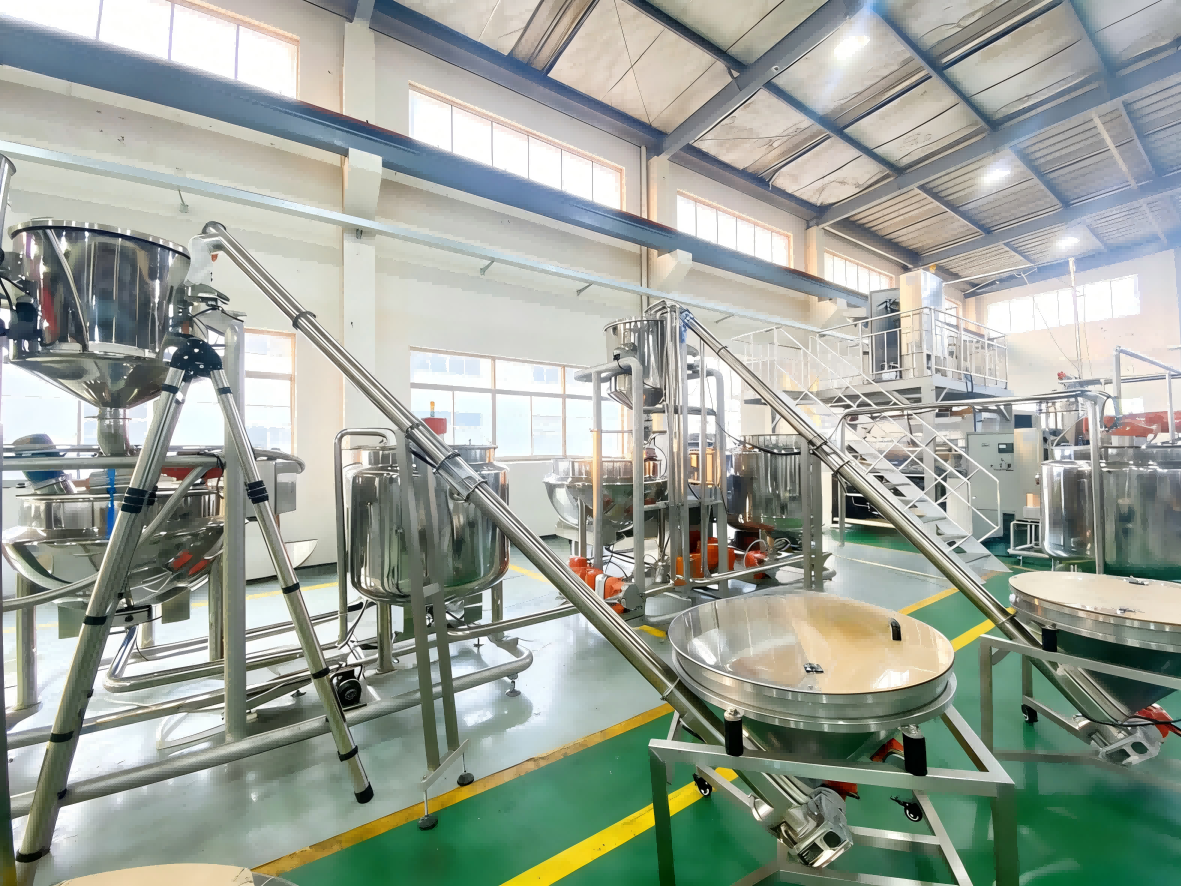
In the competitive world of food production, especially for biscuit and candy gummy factories, maintaining optimal production line efficiency is crucial for profitability and quality control. Data analytics provides a powerful toolkit to monitor, analyze, and improve these operations. By leveraging real-time data from your machinery, you can identify bottlenecks, predict maintenance needs, and optimize output. This article explores practical steps to implement data analytics, drawing on insights tailored for factories like those producing biscuits or gummy candies. Whether you’re running a high-speed gummy depositor or a biscuit baking line, YTjellycandymachine production lines are designed with integrated sensors that make data collection seamless.
Transitioning from traditional manual monitoring to data-driven strategies begins with understanding key performance indicators, or KPIs. These metrics form the foundation of any analytics effort, allowing you to quantify efficiency across your production line.
Key Metrics for Production Line Efficiency
The first step in using data analytics is selecting the right metrics to track. For biscuit and candy gummy production, focus on throughput, downtime, yield rates, and energy consumption. Throughput measures units produced per hour, essential for gummy molding lines where speed directly impacts daily quotas. Downtime tracks unplanned stops, often caused by equipment jams in high-viscosity candy mixers. Yield rates reveal material waste, critical in biscuit forming where dough inconsistencies lead to rejects. Energy metrics help optimize heating in ovens or cooling tunnels.
YTjellycandymachine integrates these metrics directly into its control systems, enabling factories to capture data without additional hardware. By analyzing these KPIs over time, you gain insights into patterns, such as peak efficiency during optimal ambient temperatures for gummy setting.
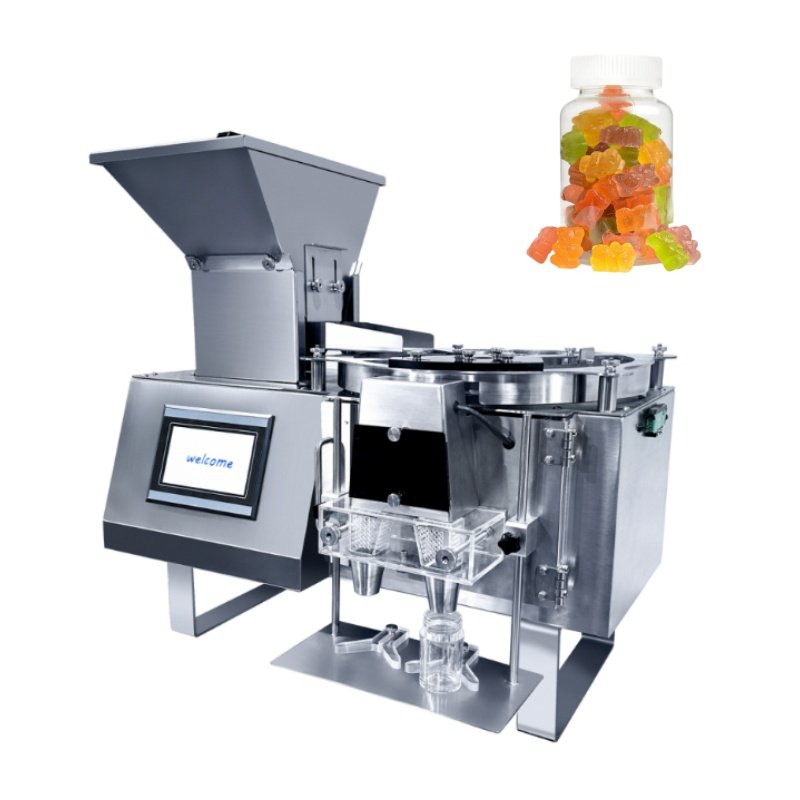
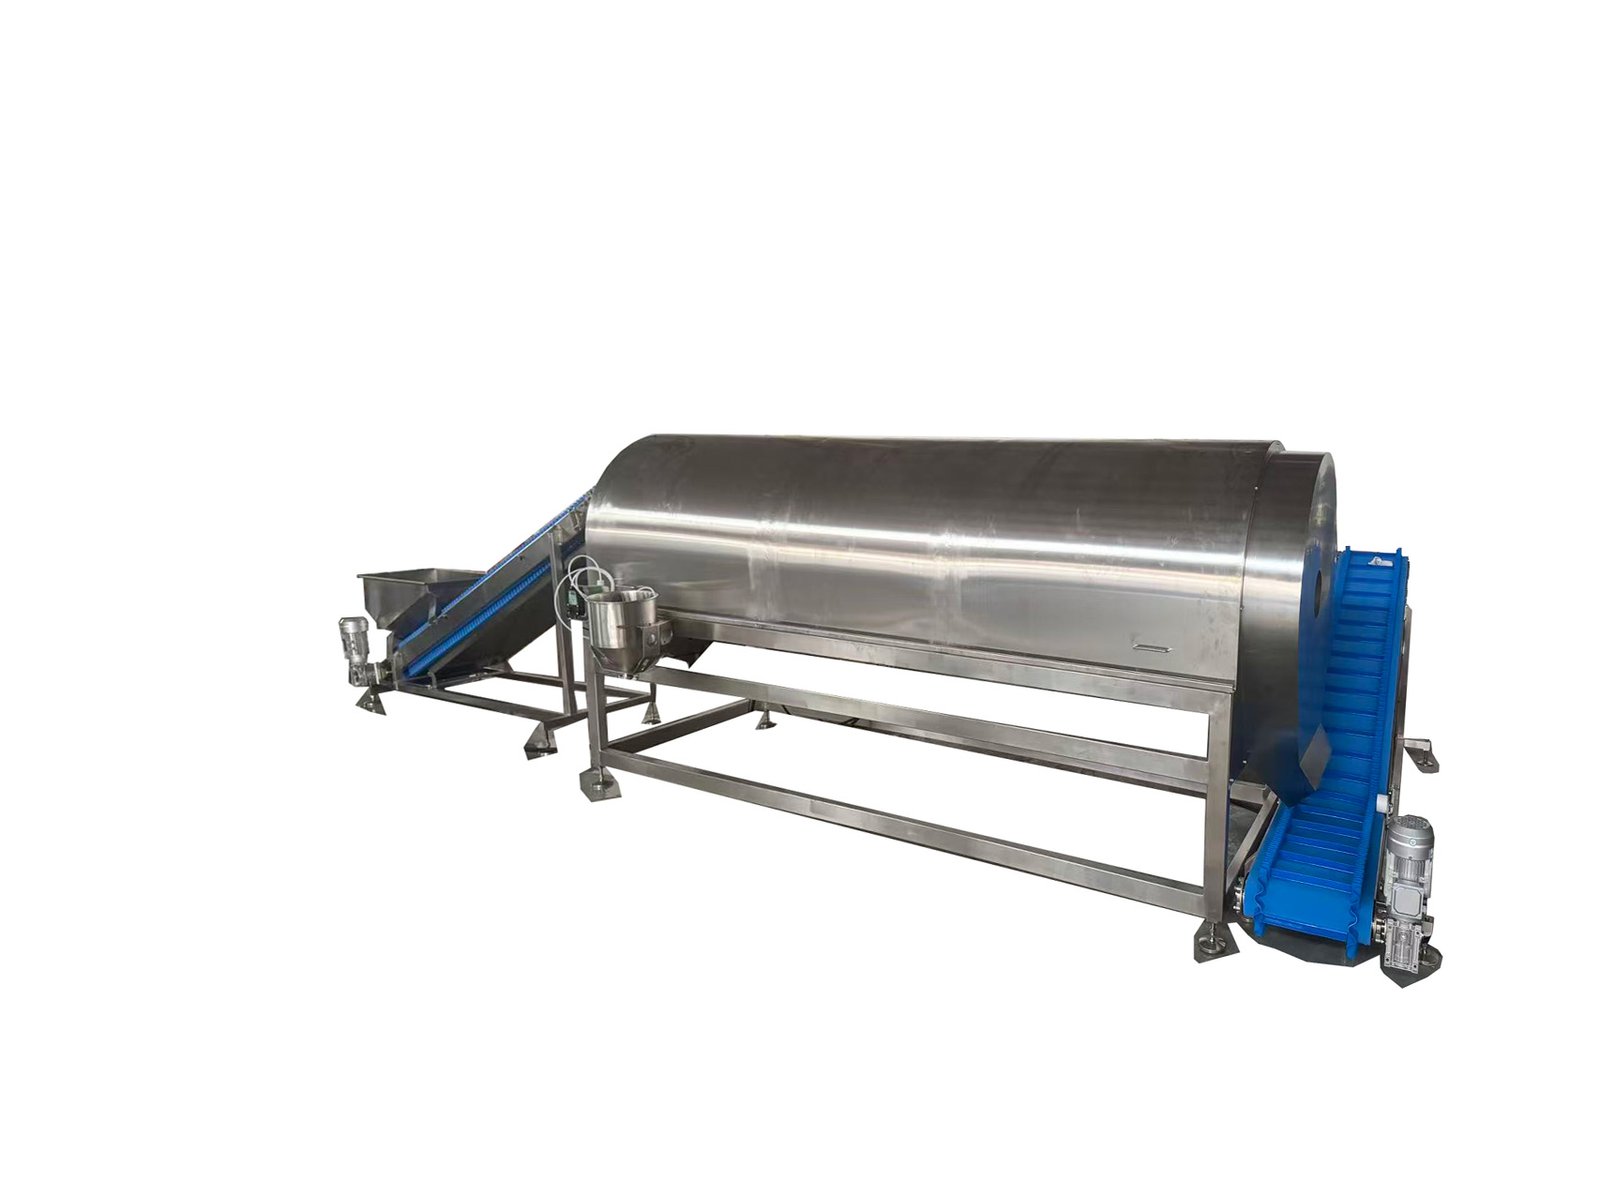
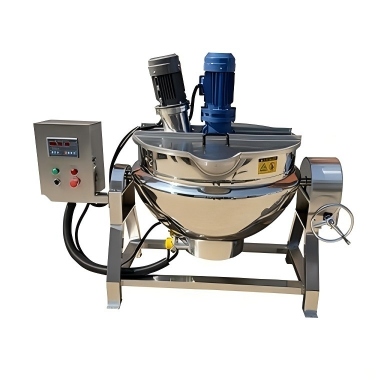
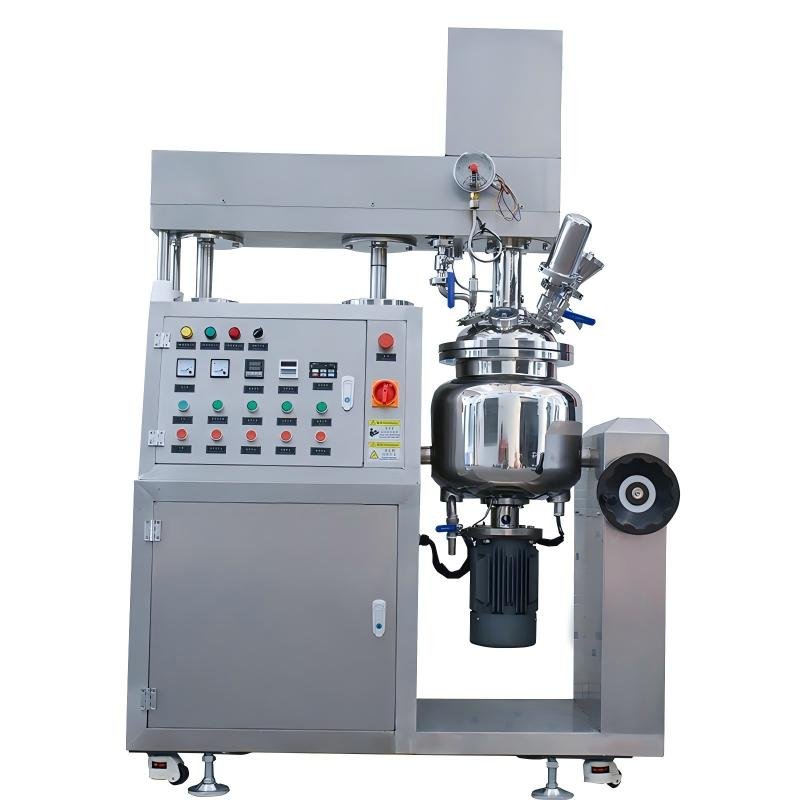
Once metrics are defined, the next phase involves data collection and integration, ensuring a smooth flow of information from machines to analytics platforms.
Collecting and Integrating Data
Modern production lines, like those from YTjellycandymachine, come equipped with IoT sensors, PLCs, and SCADA systems that automatically log data. For biscuit factories, this includes oven temperature logs and conveyor speeds; for gummy lines, it’s depositor accuracy and cooling cycle times. Use middleware software to aggregate data from disparate sources into a centralized dashboard.
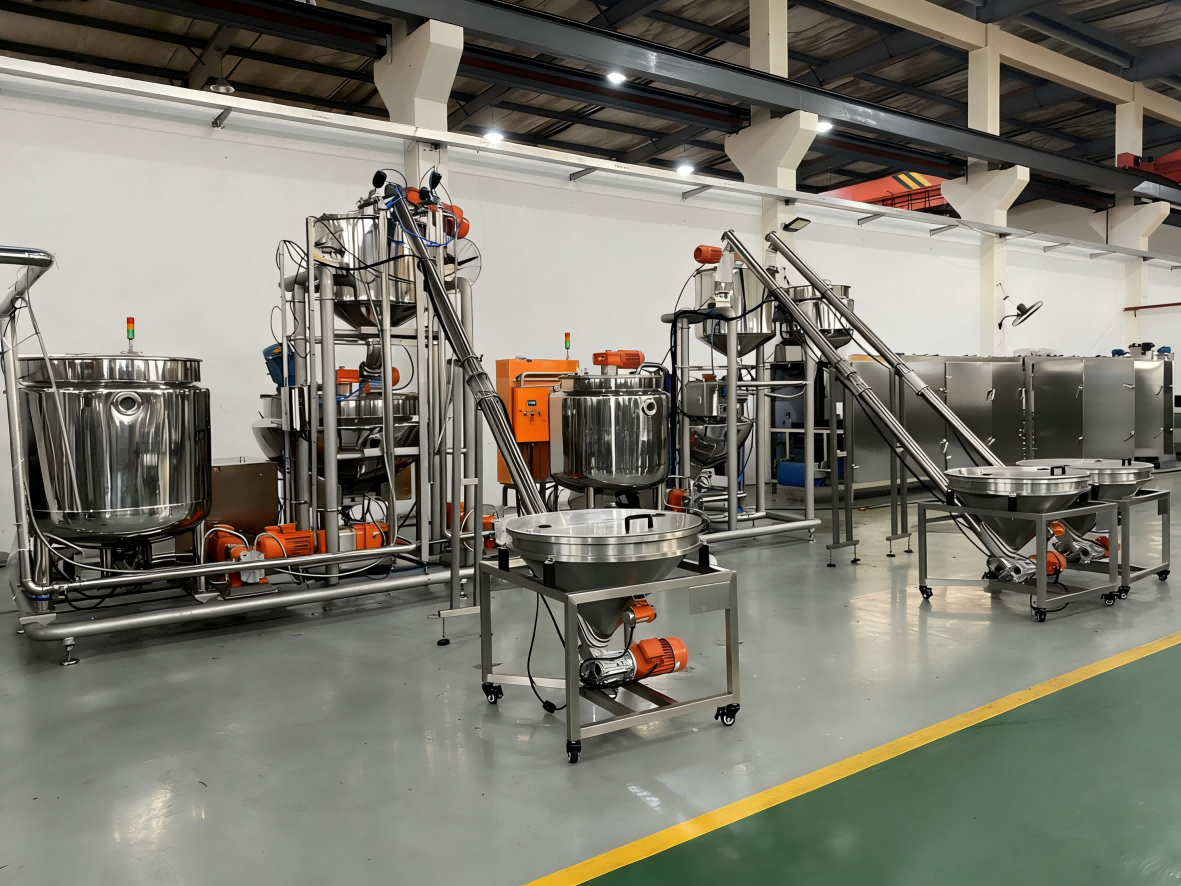
Start by installing edge computing devices on your YTjellycandymachine equipment to preprocess data locally, reducing latency. Cloud platforms such as AWS IoT or Azure Analytics then store and process this information. This setup allows real-time visualization, helping operators spot issues instantly, like a sudden drop in gummy deposition rates due to mixer overload.
With data flowing reliably, analytics tools transform raw numbers into actionable intelligence. This leads naturally to visualization techniques that make complex data accessible.
Visualizing Data for Quick Insights
Dashboards are the heart of data analytics, turning numbers into charts and graphs. Tools like Tableau or Power BI connect to your production data, displaying live KPIs. Imagine a dashboard showing a line chart of daily biscuit output versus target, highlighting dips correlated with flour moisture variations.
For candy gummy factories, heat maps can reveal hotspot inefficiencies in tunnel coolers. YTjellycandymachine’s proprietary software includes pre-built dashboards, customizable for your specific line configurations. These visualizations not only aid daily decisions but also facilitate team training by making efficiency trends intuitive.
Building on visualization, advanced analytics unlock predictive capabilities, shifting your factory from reactive to proactive management.
Applying Predictive and Prescriptive Analytics
Predictive analytics uses machine learning algorithms to forecast issues. For instance, regression models can predict biscuit oven failures based on vibration and temperature data. In gummy production, time-series analysis forecasts deposit head clogs from viscosity trends.
Prescriptive analytics goes further, recommending actions—like adjusting mixer speeds on YTjellycandymachine lines to prevent waste. Implement these via platforms like Google Cloud AI or Python libraries such as TensorFlow, trained on historical data from your operations.
To illustrate practical implementation, consider the following numbered steps for setting up a basic analytics pipeline:
- Assess your current YTjellycandymachine production line sensors and identify data gaps.
- Choose an analytics platform compatible with food-grade machinery standards.
- Integrate data streams and define KPIs specific to biscuits or gummies.
- Develop custom dashboards and train models on 3-6 months of historical data.
- Roll out to operators with training sessions and monitor adoption.
This structured approach ensures quick wins. Now, let’s examine real-world efficiency gains through a comparative table.
| Metric | Before Analytics (Avg. Monthly) | After YTjellycandymachine Analytics (Avg. Monthly) | Improvement (%) |
|---|---|---|---|
| Throughput (units/hour) | 5,000 | 6,200 | 24% |
| Downtime (hours) | 120 | 45 | 63% |
| Yield Rate (%) | 92% | 97% | 5.4% |
| Energy Use (kWh) | 15,000 | 12,500 | 17% |
This table, based on YTjellycandymachine client implementations in biscuit and gummy factories, demonstrates tangible benefits. Notice how reduced downtime directly boosts throughput, creating a virtuous cycle of efficiency.
Addressing common challenges is essential for sustained success. Data silos, skill gaps, and data quality issues often hinder progress. Overcome silos by standardizing protocols across machines. Invest in training for staff to interpret analytics outputs. Ensure data accuracy through regular sensor calibrations, particularly vital in humid environments affecting gummy production.
Finally, continuous improvement loops tie everything together. Regularly review analytics reports, set new benchmarks, and iterate on models. YTjellycandymachine supports this with firmware updates that enhance sensor precision over time.
Conclusion
Harnessing data analytics transforms production line efficiency from guesswork to precision science, particularly for biscuit and candy gummy factories. By tracking key metrics, visualizing insights, and applying predictive tools integrated with YTjellycandymachine systems, you achieve higher yields, lower costs, and superior quality. Embrace these strategies today to stay ahead in the food production landscape, ensuring your operations run as smoothly as a well-deposited gummy sheet.
Last Updated on June 7, 2026 by YTjellycandymachine